


Outliers
Overview
Outliers are data values that are much higher (or much lower) than most data values in a single domain. You should either "cut" them down (or up) to some value, or remove them.
You will learn about:
- outliers and topcuts
- methods of determining a topcut value
- applying a topcut
Requirements
In order to understand this information, you should:
- be familiar with Surpac string files
- know how to run a Surpac macro
Outliers and topcuts
An "outlier" is a statistical term for a value that is significantly different than the majority of all other values in the data set. For example, in the following data set, the number 236 would be considered an outlier:
1 3 5 5 8 8 8 236
Outliers can cause "noisy" experimental variograms, which are difficult to model. Additionally, if you use outliers in an estimation, they can cause unrealistic results. One technique to reduce the effect of outliers is to apply a "cutoff", or "topcut" to them. In the example above, the value of 236 could be "cut" by changing it to a value of 9:
1 3 5 5 8 8 8 9
The alternative is to remove the outlier value:
1 3 5 5 8 8 8
Methods of determining a topcut value
There are many methods that you can use to determine a topcut value, using:
- histogram
- confidence interval
- percentile
- experience
Histogram
You can use the point at which the cumulative frequency curve "flattens out" as the cutoff. In the following situation, the curve appears to be fairly flat at a value of 25.
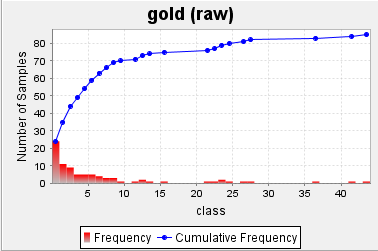
A histogram can also help visually substantiate the choice of a topcut value obtained by other means.
Confidence interval
A confidence interval is an estimated range of values which is likely to include a given percentage of the data values, assuming that the data is normally distributed. The calculation for the upper limit of a 95% confidence interval (CI) is:
95% CI = mean + (1.96 * standard deviation)
For example, if a data set has:
mean = 6.49 and standard deviation = 9.30.
95% CI = 6.49 + (1.96 * 9.30)
95% CI = 24.718
Percentile
A percentile is that data value at which a given percentage of all other data values fall below. Any given percentile value could be selected as the outlier cutoff, such as the 90th, 95th, or 99th percentile. For example, you could choose one of the following (from the previous Basic Statistics report):
90.0 Percentile: 22.5
95.0 Percentile: 27.2
97.5 Percentile: 38.8
99.0 Percentile: 42.4
Experience
Topcut values are often chosen based on knowledge of a deposit. For example, if part of an ore zone has been mined, information from grade control samples and reconciliation studies may provide a good idea of what the maximum mined block value will be. If the deposit has not yet been mined, information from similar deposits may be useful in determining the outlier cutoff.
Topcutting outliers
The process of determining a topcut is usually much longer and more difficult than applying a topcut in Surpac. Whatever method is chosen, you can cut values in a description field in a string file using STR MATHS.
Task: Applying a topcut
You will apply a topcut value of 25 to the gold values in the D1 field of the file gc_zone1_130.str.
- Choose File tools > String maths.
- Enter the information as shown, and click Apply.
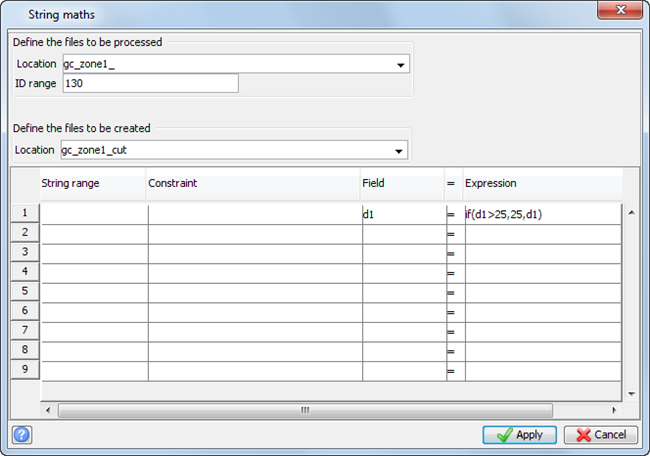
The expression states:
If the value of d1 is greater than 25,
then set the value of d1 equal to 25,
else leave the value of d1 as it is.
To see all of the steps performed in this task, run 2d_03b_cut_outliers.tcl.
Menu commands:
| Select... | to... |
|---|---|
| File tools > String maths | apply a topcut value. |